
Prime Day is Amazon’s annual deal event exclusively for Prime members, featuring epic deals on top brands and small businesses. What started in 2015 as a way to celebrate Amazon’s 20th birthday, Prime Day turned into an annual ritual due to its massive success.
Despite its name, Prime Day is held over two days with 48 hours’ worth of exclusive discounts and limited-time savings. With thousands of deals, customers are bound to find something worth buying.
But Prime Day isn’t just about those 2 days. The anticipation of the event and promotions of deals start about 2-3 weeks prior to the actual dates. The days up to the mega sale event are full of excitement with brands promoting their deals and products to grab the eyeballs of the Prime members.
This year’s excitement levels were no different.
As per Amazon, Prime members worldwide purchased more than 100,000 items per minute during this year’s Prime Day event
We, at PiWheel, used our competitor and market intelligence tool to analyze Prime Day for India- one of the fastest growing eCommerce regions in the world- and found some very interesting data points that will be useful lessons for brands.
What we have covered:
Like every year, the categories in consumer electronics topped the charts to become the highest gainers in India.
Amazon announced up to 75% discounts on laptops, headphones, and other electronics during the sale. For instance, Redmi’s 50-inches 4K Ultra HD Android Smart LED TV was offered at INR 29.9K while its regular price is INR 45K. Similarly, boAt launched its new wearable tech product ‘boAt Wave Call Smart Watch’ at INR 2k.
But the concerns of surging inflation rates, topped by supply chain woes, definitely had an impact on some electronics categories such as tablets (-13.40%) and refrigerators & freezers (-16.42%) that saw a decline in sales as compared to 2021.

As per Republic World, “Members in India were in favor of upgrading their existing large appliances and bought front load washing machines, double door, and side-by-side refrigerators, inverters, and ACs from top-selling brands like Samsung, LG, Whirlpool, Bosch, IFB, etc.”
While Cell Phones remained the top category by retail sales in India, the ad spend of the category actually decreased by a whopping –51% from last year’s prime weeks.
Xiaomi was the top brand in terms of sales attributed to promotions. The brand’s sales increased by 20% due to the various offers run by the brand. The next 2 brands on the list were Apple (+60%), and Samsung (+194%).
Washers & dryers gained the biggest share from promotions.

The top 4 products (by retail sales) in the 5 shakers categories:


Apart from consumer electronics, there were some categories that were extremely popular among the consumers of India. These include everyday essential items, beauty & personal care, clothing & accessories, and pet food.
Let’s take a deeper look:
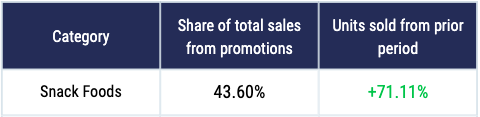
As per our market intelligence tool, the sub-category ‘Snack Cakes and Pastries’ saw the highest lift (+105%) in snack foods from 2021 Prime weeks, indicating increased stickiness and successful penetration of Amazon’s groceries’ initiatives.
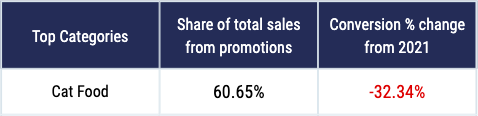
Cat canned foods saw the largest Prime Day lift of any pet category on Amazon, with shoppers purchasing nearly 20x as many items during Prime Weeks 2022 as compared to 2021. 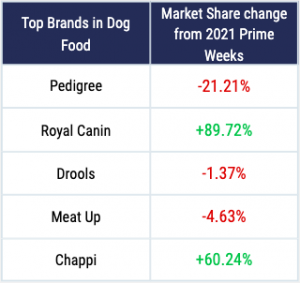
Chappi brand’s ‘Chappi Adult Dry Dog Food, Chicken & Rice, 20kg Pack’ saw the highest sales in the dog food category.
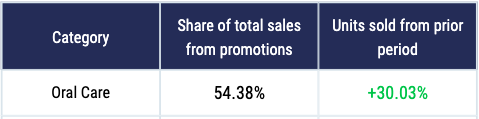
We also noticed jumps in ad spend for the ‘Oral Care’ category while the ‘Facial Skin Care’ experienced a 95% jump in ad spend.
There were other categories too which saw massive sales growth compared to 2021 such as Diapers & diapering accessories (+17.51%), Men’s Shoes (+31.49%).
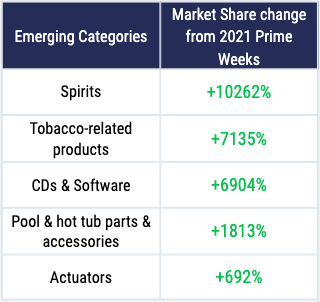
There are some categories that although didn’t experience as huge retail jumps as the shakers, saw a massive increase in growth from last year’s Prime weeks.
2022 Prime Day is over but that doesn’t mean you wrap the event in the closet! Let’s take a look at a few quick tips so you can apply Prime Day learnings to your Amazon Business in the future:
Data Source: PiWheel’s market intelligence tool
Data timeline: Jul 17 – Jul 30, 2022 vs Jul 18 – Jul 31, 2021


